中EN
Time, Not Timing
Dollar-cost averaging into the S&P 500, the tech giants, or Bitcoin, the ten-year results were very good whether you started at the worst moment or the best, and the longer you keep it up, the higher the multiple; what makes dollar-cost averaging pay is not the bull market but the long bear market.
1. What dollar-cost averaging is
The dollar-cost averaging strategy is this: pick an investment, and over a very long time, put a fixed amount into it at regular intervals.
2. Ten years of dollar-cost averaging: what happens
If you dollar-cost average for ten years, what do the results look like? Let's take three investments: the S&P 500, the US tech giants AN ATM (Apple, Netflix, Amazon, Tesla, Microsoft), and Bitcoin.
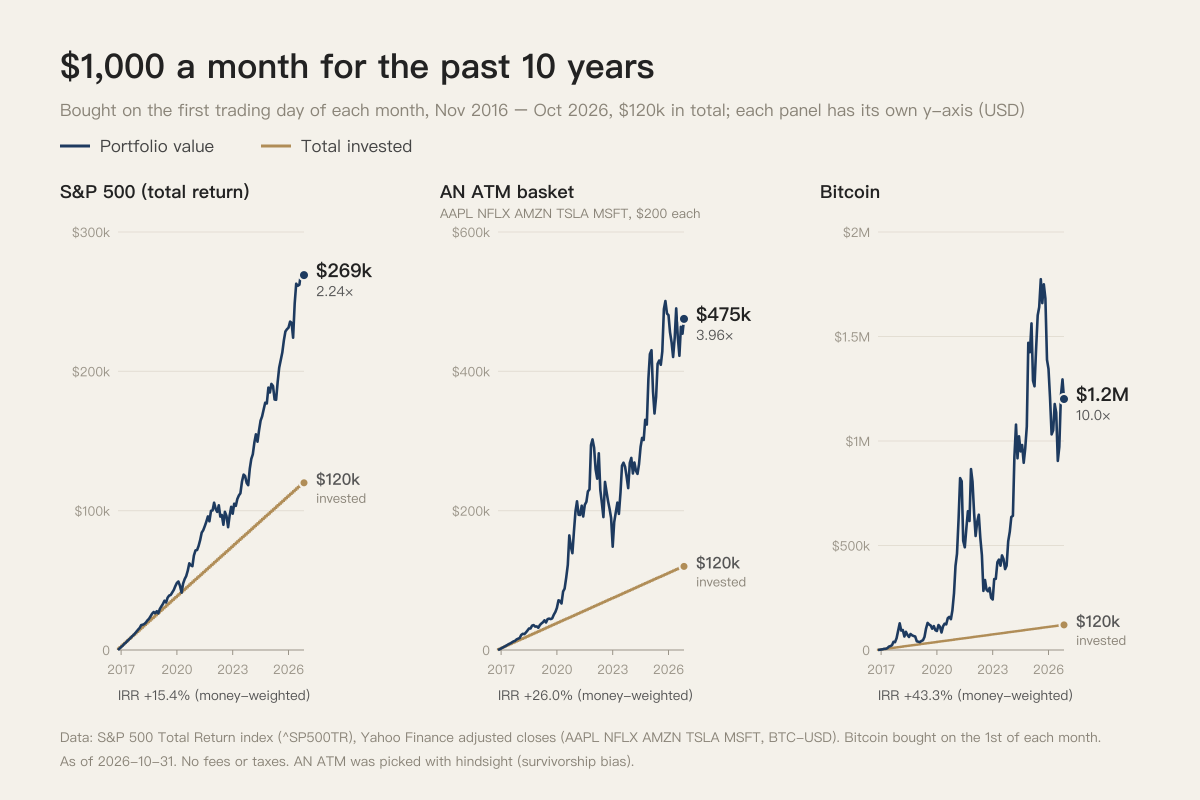
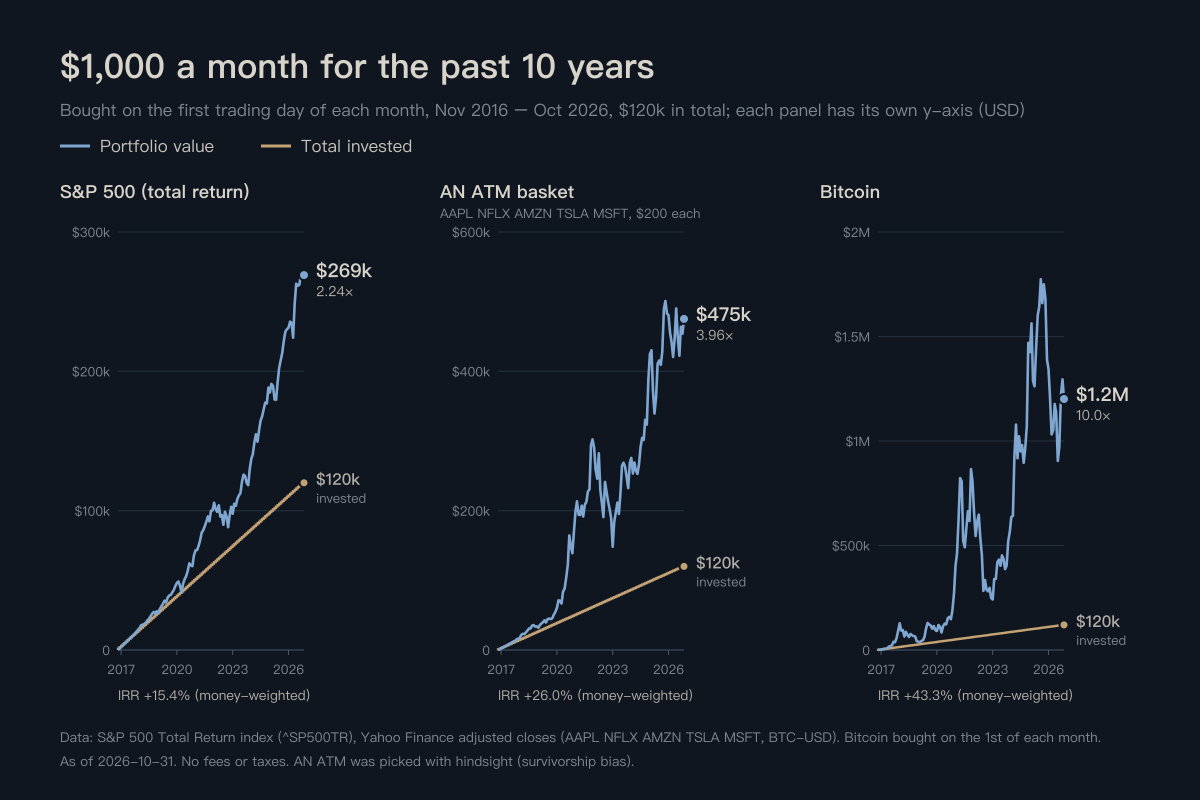
Starting in November 2016, put in $1,000 every month for a full ten years, $120,000 in total:
- S&P 500: grown to $269,000, 2.24 times.
- AN ATM: grown to $475,000, 3.96 times.
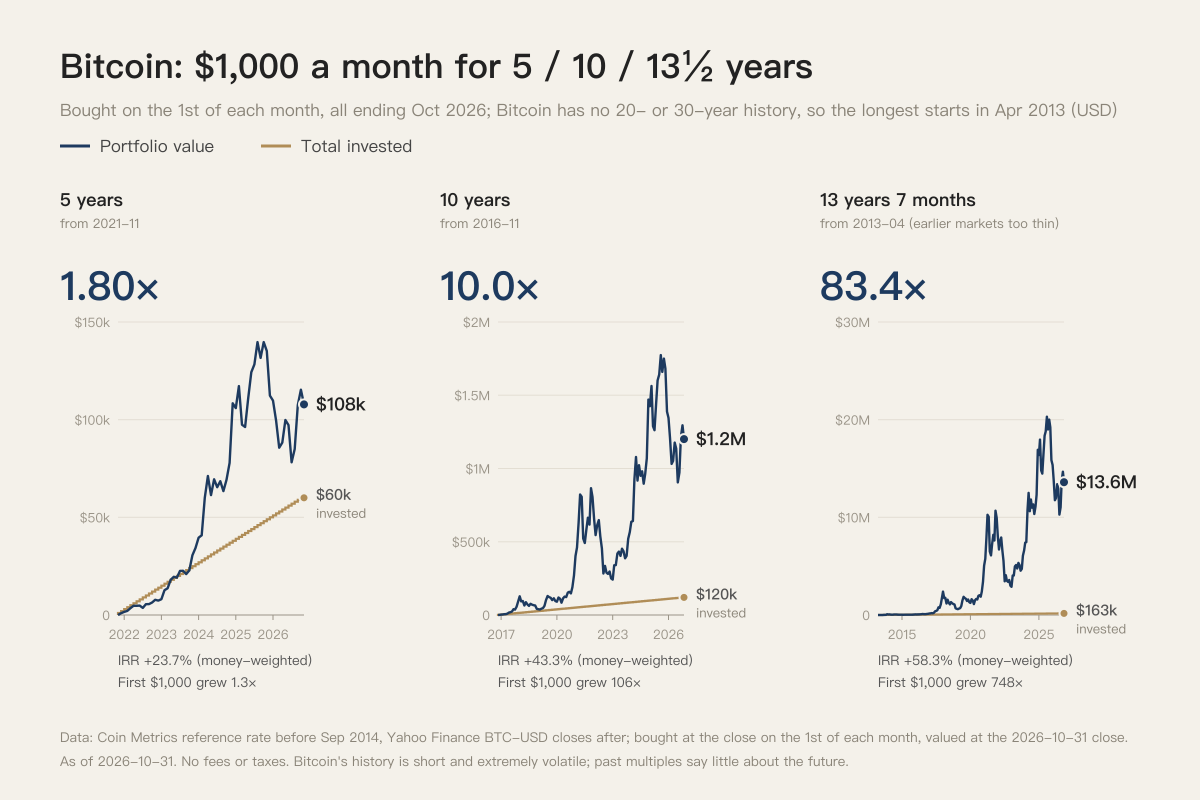
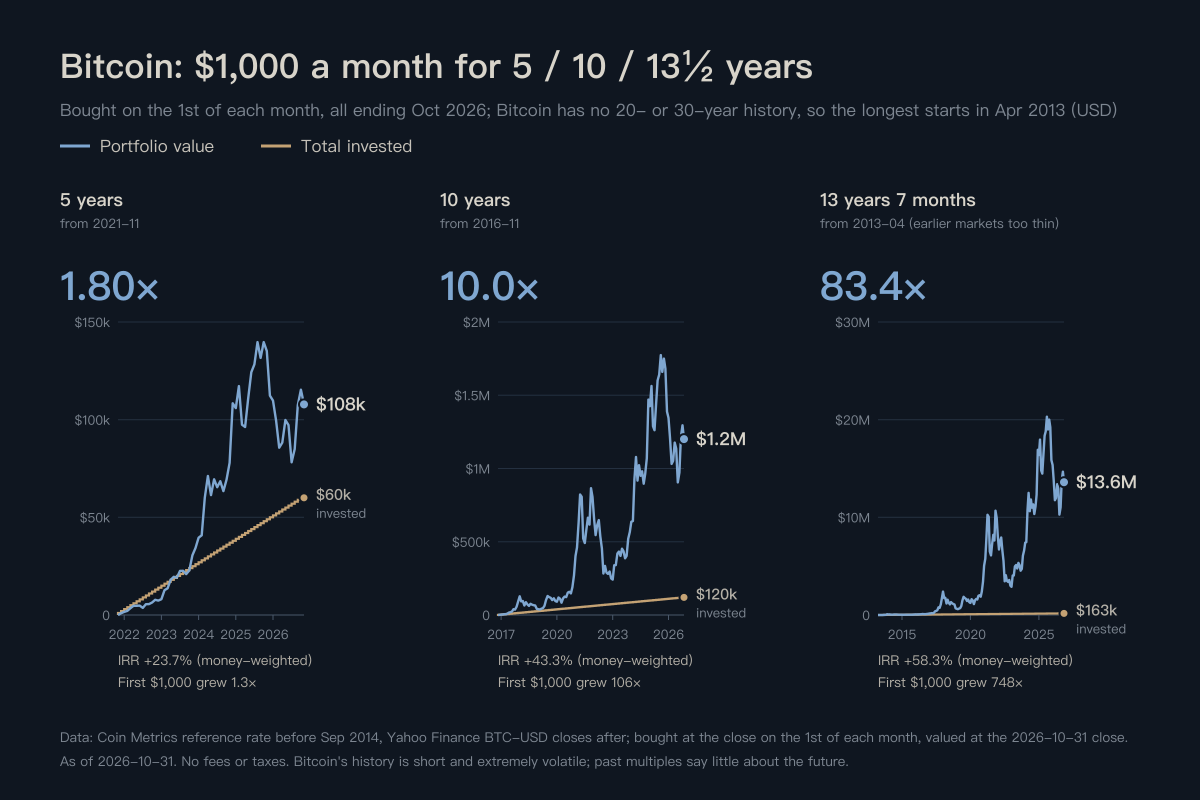
- Bitcoin: grown to $1.2 million, 10 times.
The S&P, the tech giants, Bitcoin: each one returns more than the last. Why is that? Just remember this order for now; we'll get to it in the next post.
Below are the total amount invested and the net assets in your hands:
3. The worst timing, the best timing
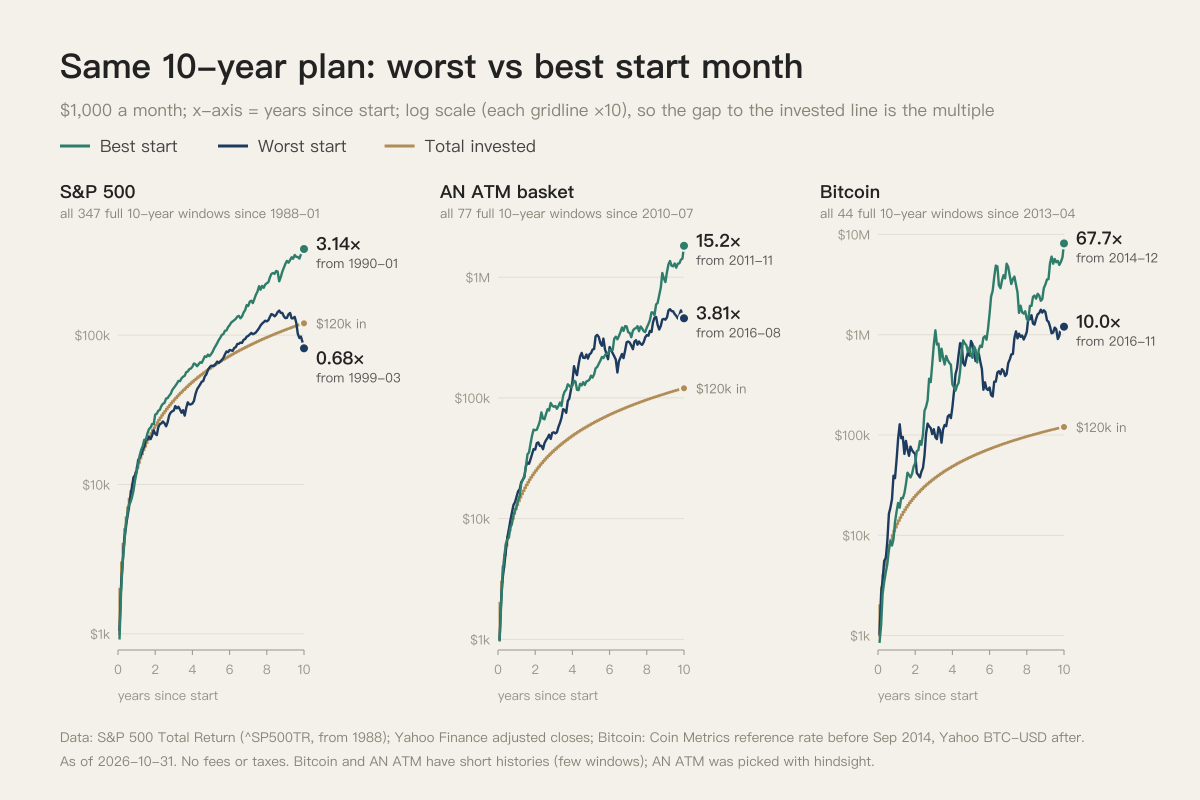
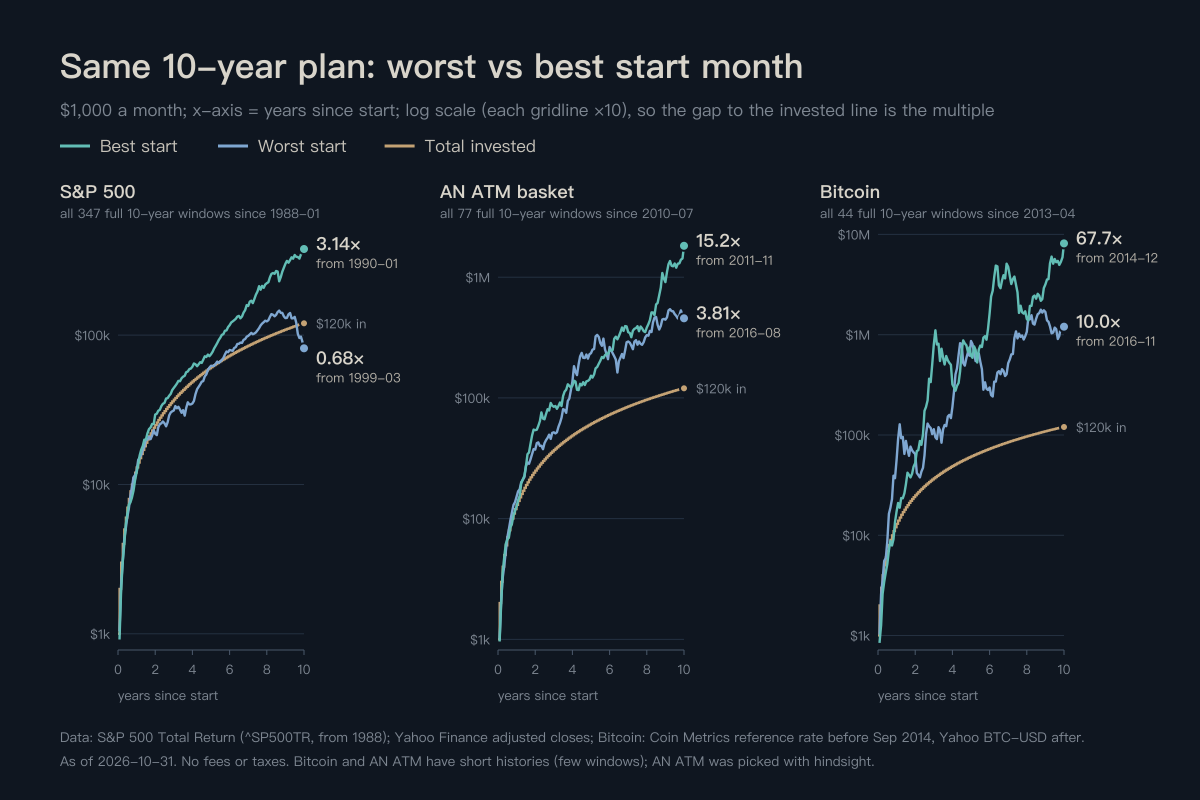
Now let's try different entry points: pick the worst possible time and the best possible time, and dollar-cost average for ten years from each.
- S&P 500: worst 0.68 times, best 3.14 times.
- AN ATM: worst 3.81 times, best 15.2 times.
- Bitcoin: worst 10 times, best 67.7 times.
That worst S&P one started in March 1999, and its ten years ended right at the worst point of the 2009 financial crisis. But keep it up for just one more year, and it was back to even.
Here are the curves:
4. Ten years, twenty years, thirty years
We keep talking about ten times in ten years: a 25% compound annual return is ten times in ten years, 100 times in twenty, 1,000 times in thirty. The power of compounding is all in the time.
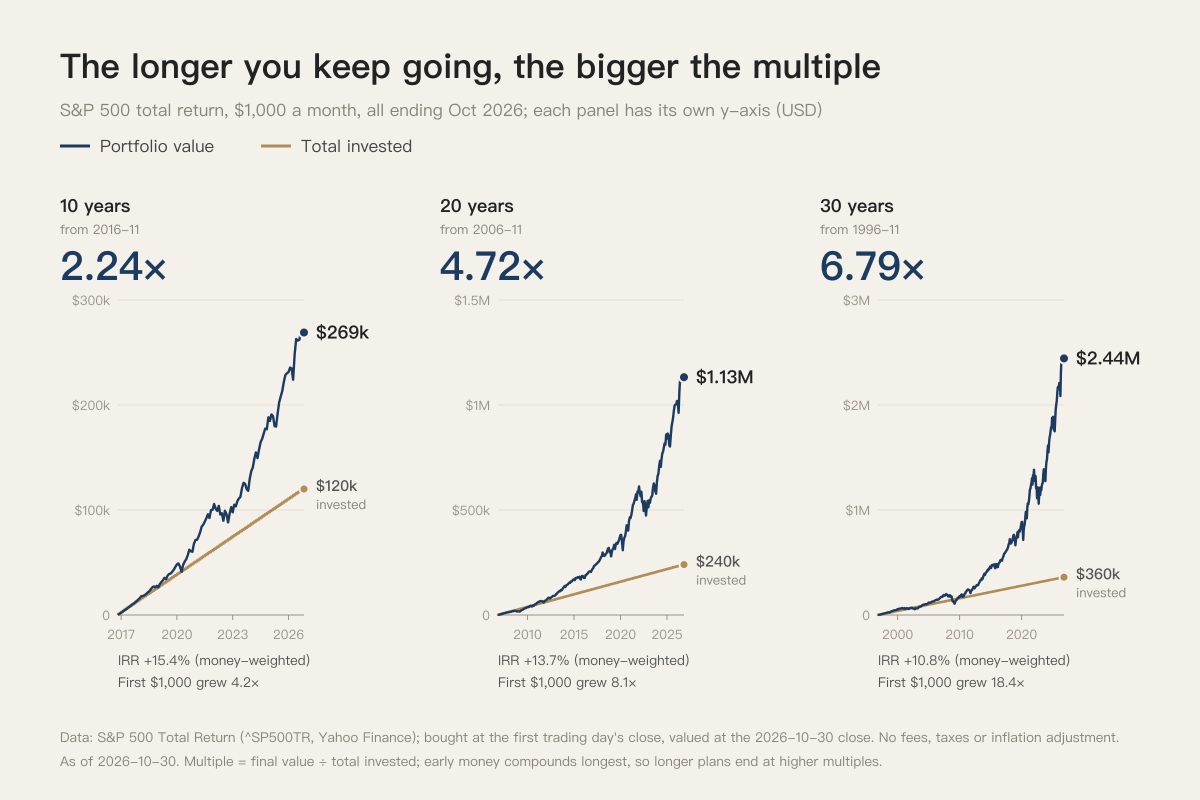
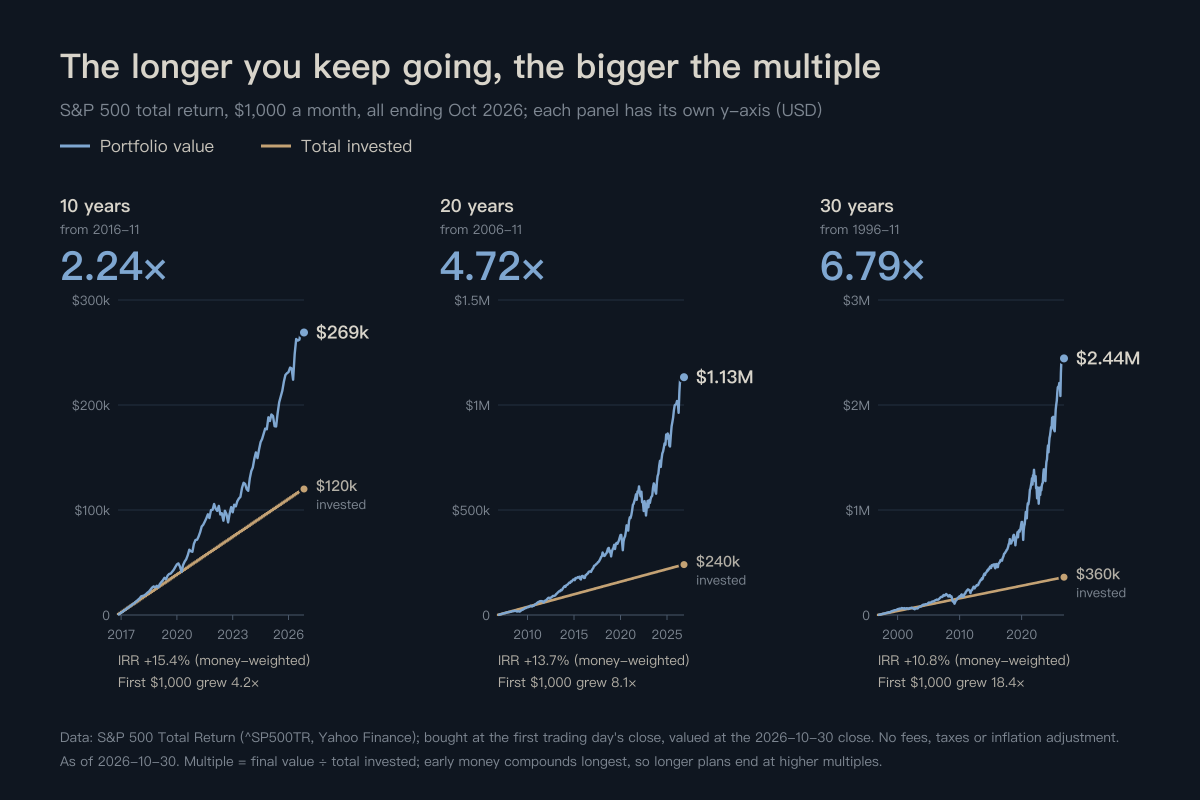
Dollar-cost averaging is the same: the longer the time, the higher the multiple. $1,000 a month into the S&P 500, all the way to October 2026:
- 10 years: $120,000 in, grown to $269,000, 2.24 times.
- 20 years: $240,000 in, grown to $1.13 million, 4.72 times.
- 30 years: $360,000 in, grown to $2.44 million, 6.79 times.
The money put in grew by only two times over, but the assets grew by more than eight times over. That's because the earlier the money goes in, the longer it compounds: the first $1,000 put in 30 years ago is 18 times that today.
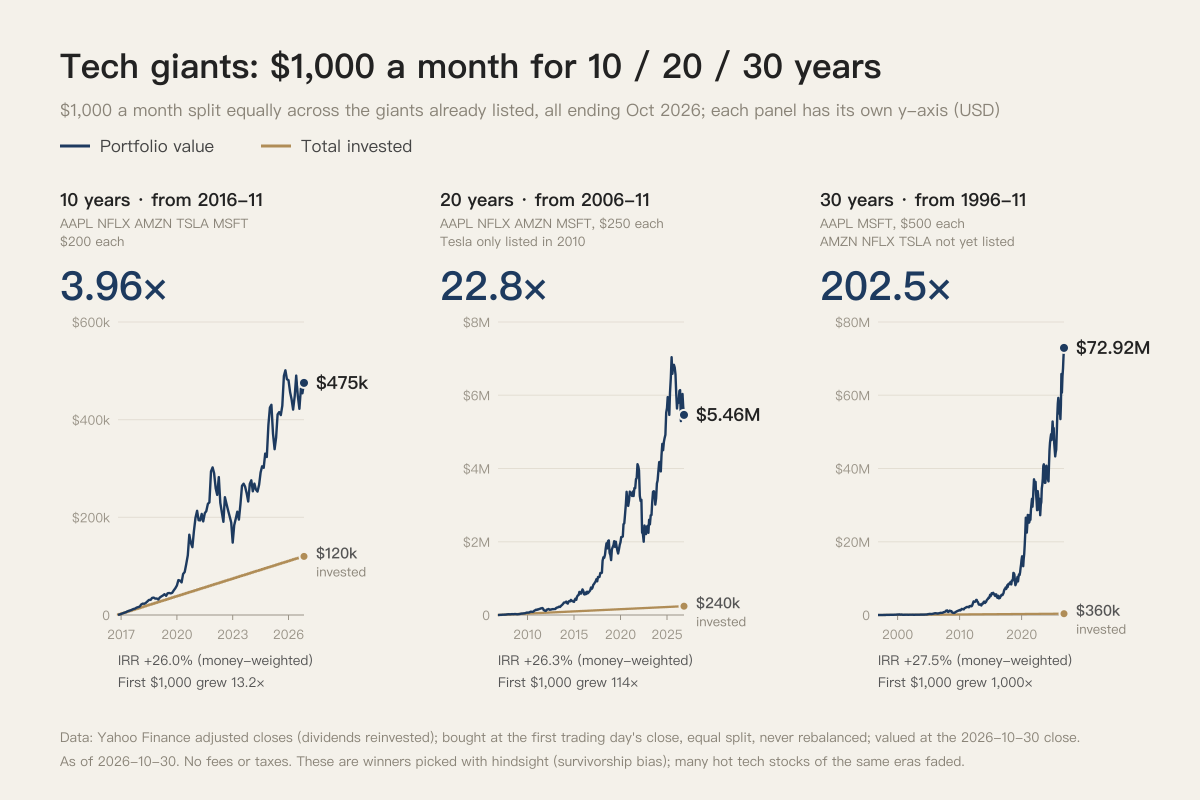
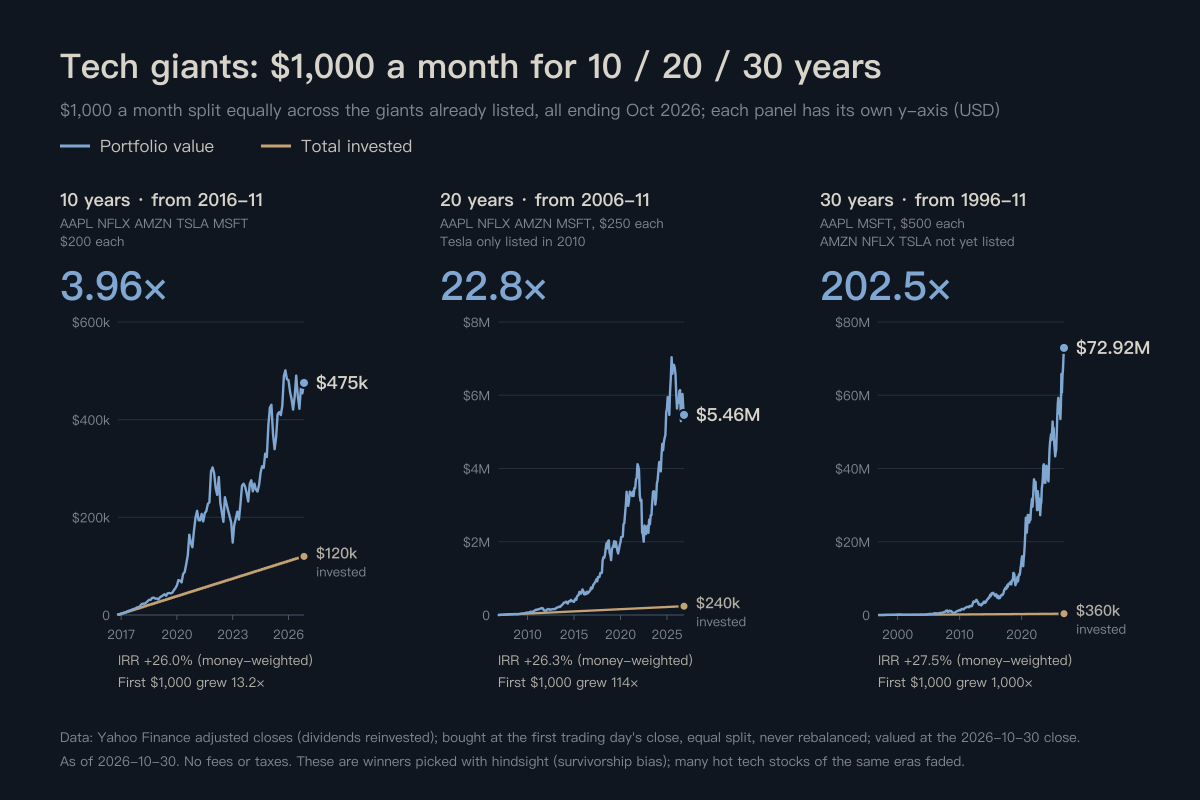
Switch to the tech giants, and dollar-cost averaging comes to 3.96 times over ten years, more than 22 times over twenty, and 200 times over thirty, all around 26% a year, right at the pace of ten times in ten years.
Bitcoin's history is still short; there are no twenty or thirty years yet. Dollar-cost averaging from April 2013 to today, a little over thirteen years, comes to 83 times.
5. Time, not timing
The results are there for anyone to see: no matter when you get in, as long as you keep dollar-cost averaging and hold long enough, say ten years, the end result is very good. Even if your luck is as bad as it gets, and your ten years end right in a once-in-decades crash, hang on another year or two and the result is still very good.
From this data, we come back once again to something I've said before: with dollar-cost averaging, we don't look at timing, we look at time. Out there, people use every method they can, straining with all their might to study when to invest, reading all kinds of candlestick charts, trying all kinds of quant strategies. We don't spend any of that energy. As long as you dollar-cost average for long enough, time smooths out all those differences.
Someone who uses dollar-cost averaging, even if they get in at the worst possible time, can always turn a profit early.
Take October 2007: start dollar-cost averaging at the S&P 500's peak before the financial crisis, and two years later the account was back to even; but the index itself took four or five years to climb back to the price you got in at. Dollar-cost averaging broke even two or three years before the price did.
6. The money is made not in the bull market, but in the bear market
Material on dollar-cost averaging usually says that it effectively lowers your average cost. That's not wrong, but it isn't the whole story.
The real reason is this: in financial markets, bear markets are always much, much longer than bull markets. Look at the data: since 1988, the S&P 500 has spent about 87% of its days below its all-time high; days with new highs are only a tiny minority.
So as we keep dollar-cost averaging, most of the time we're lowering our cost. When the bull market comes, that's when our harvest season has finally arrived.
In other words, the time we make money is not the bull market, but the bear market.
7. Life is dollar-cost averaging too
The same goes for life. Most of life is quiet effort, quiet cultivation; the moments in the spotlight are very brief.
Sometimes, putting in the effort even seems worse than not bothering.
Take working out. You go to the gym every day, and at first there's no effect at all. The bear market of fitness is always long; it goes on for a long time, and you give up rest time and social time, and a lot of the time it seems you'd be better off not going. But as long as you keep at it long enough, a good body always shows up, and you always end up healthier.
Or reading. You give up your entertainment time every day to read, and after a while nothing seems to have changed. The bear market of reading is long too: you don't seem any smarter, you don't seem any richer, and it costs you money and time, so it seems you'd be better off not reading. But as long as you keep reading, every day, in the end, compared with people who don't read, your understanding is worlds apart, and so is the path your life takes.
Dollar-cost averaging works not only in financial markets, but in every part of life.
8. Getting rich slowly, getting smart slowly
Very few people like getting rich slowly; the slogans everywhere are about getting rich fast, getting rich overnight. Very few people like getting smart slowly either; what you see everywhere is master XXX skill fast, all kinds of tricks, all kinds of crash courses.
A lot of the time, it's not that I don't want to share; it's just that sharing only gets you laughed at, so people choose to go their own ways, each living their own life.
But we are different. If we've chosen to dollar-cost average until it changes our lives, we have to learn all of this and make it part of how we think.
9. Next: what to actually invest in
In the next post, we'll talk about this: I'm ready to start dollar-cost averaging now, but what exactly should I invest in? Out there you'll find ten thousand explanations, but just the same, here our theory is very simple, nothing that complicated. We'll talk about which investments to actually choose.